
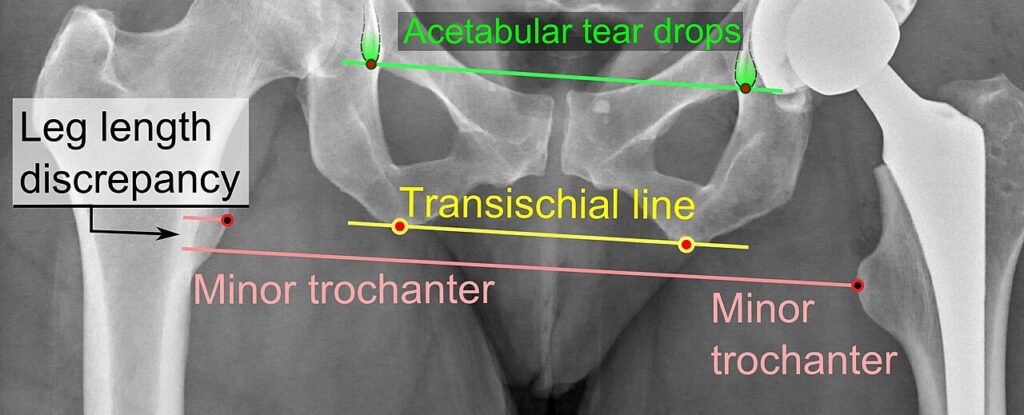
Leg length discrepancy may be structural or functional. Predicting the final difference with growth charts or the multiplier method guides treatment, from a shoe raise for small differences to epiphysiodesis of the longer leg or limb lengthening for larger ones.
Growth
Menelaus Rule
- 54% of length from femur
- proximal 4 mm/year
- distal- 9mm/yr
- 46% from tibia
- proximal 6mm/yr
- distal – 4mm/yr
Green & Anderson Chart
- plots growth remaining
Straight Line Graph of Moseley
- a manipulation of the Green Anderson Data
Data Analysis
Arithmetic Method – Menelaus
- Assume physis grow at 4,9,6,4 mm / year
- Assume that
- girls stop growing at 14
- boys at 16 years
- Inhibition is calculated
- Growth of the long leg
- growth of the short leg/ growth of the long leg
- Essentially gives the amount that the short leg is losing for each cm of growth by the healthy leg
- Future Discrepancy = current discrepancy + (Growth remaining in the leg) (inhibition)
Growth Remaining Method of Green & Andersen
- Uses Green Anderson charts of growth remaining in distal femur and proximal tibia by skeletal age
- Skeletal age from a hand and wrist X-ray using the Greulich and Pyle atlas
- Percentage growth inhibition calculated from at least two serial measurements
- Predicted discrepancy equals current discrepancy plus normal limb growth remaining multiplied by inhibition
- Charts give the timing of epiphysiodesis for the correction required
- Assumes a constant percentage inhibition through growth
Straight Line Method (Moseley)
- Plot the long(normal) leg on the reference slope
- Plot the short leg below this
- Now plot the skeletal age based on calendar or wrist X-ray
- Draw in more points
- Get an average age curve & draw this out to where it ends for girl or boy respectively
- Drop a perpendicular which will hit the long leg at maturity
- Line of best fit for short leg intersects this perpendicular to give length at maturity
- epiphysiodesis lines show what happens if you change the slope o
- These methods assume a stable inhibition
Inadequate Data
- Extrapolate back to the time when both legs were O length
Reviewed by Professor Phong Tran, Head of Orthopaedic Surgery, Western Health. Last updated 10 October 2026.